
Real-time utility optimization with ENetOPT, multi-period production planning with ENetPLAN, and EIM monitoring — modelled on your plant's own energy network.
Utility Energy Network Balance & Optimize
ENetOPT is a software platform for optimizing the performance and efficiency of a plant energy network. Model mixed energy sources, distribution paths and consumers by drag and drop, then compute the optimal operating point in real time on top of a rigorous mass and energy balance.
Core Capability
What ENetOPT does with plant measurements, from a reconciled balance to the optimal operating point.
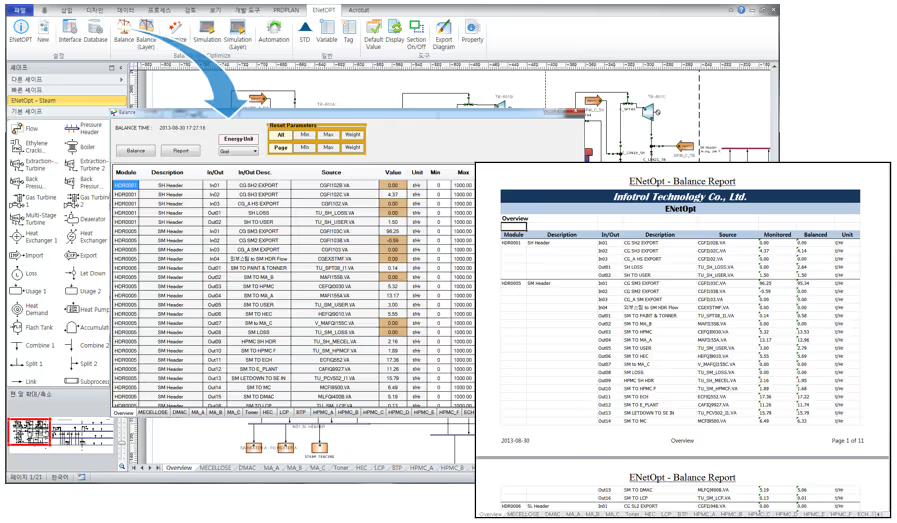
Steam, electricity, fuel and hydrogen production and consumption are balanced across the whole plant. Measured data is reconciled through a constrained quadratic program, and hydrogen concentration is carried into the mass balance, so every optimization run starts from a consistent picture of the site.
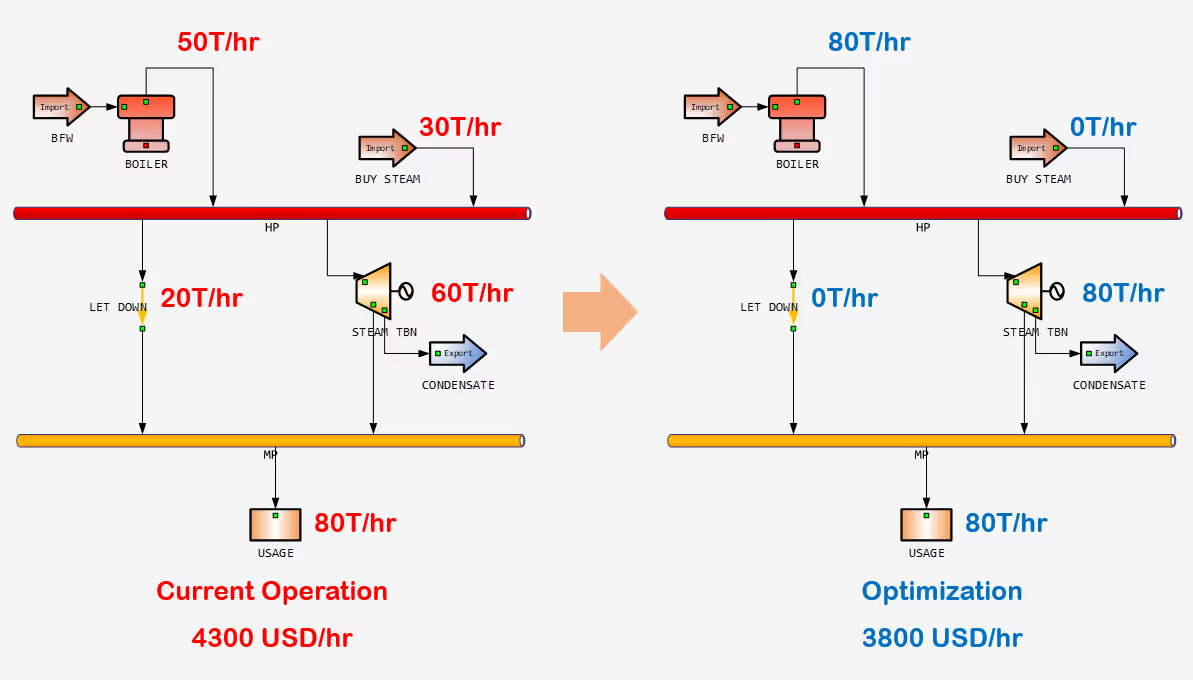
With energy demand held as a requirement, ENetOPT computes the real-time optimal operation of the integrated steam, electricity and fuel networks, prioritizing the process constraints that actually bind. Linked to steam header and turbine control systems it runs as a closed loop, and CO2 from fuel combustion can be carried in the model to respect greenhouse gas limits.
Technology
What turns raw plant measurements into an operating point the shift can act on.
Gross error detection isolates where a steam, electricity or fuel imbalance comes from, separating genuine energy loss from faulty instrumentation and bad calculated values, and validates the result.
Models of the energy production equipment used across refining and petrochemical plants are included as standard, and model settings can be pinned to values measured at a specific site.
Equipment on/off states and minimum operating loads are solved as integer variables, using the commercial Gurobi optimizer by default. Nonlinear efficiency curves for units and processes are handled by piecewise linearization.
Product Tour
Pick a step to see how ENetOPT is built and run, with a short walkthrough for each.
· Drag & Drop based visual modeling
· Multi-Layer Configuration
· Integrated thermodynamic property calculation
· Equation-based system
· Data reconciliation based mass & energy balance
· Prevent measurement and estimation error distribution using gross error detection
· Mixed Integer Linear Programming (MILP)
· Minimize energy cost
· Maximize the utilization of high value energy
Why ENetOPT
A reconciled plant-wide mass and energy balance means the numbers everyone acts on agree with each other before anything is optimized.
Steam, electricity and fuel are solved together, so the cheapest workable combination is the one you run, not the one each system would pick on its own.
Track turbines, furnaces, boilers and heat exchangers against their modeled performance, so efficiency loss shows up as a deviation rather than a hunch.
Results are passed to the steam header and turbine control systems, so the optimum is actually executed instead of sitting in a report.
Gross error detection separates real energy loss from instrument faults and bad calculated values, so a persistent imbalance points at a cause.
Read the balance as a whole, remove the imbalance, and keep supply steady with more room to move when conditions change.
Case Study

ENetOPT : Refinery Plant
Energy optimization design for a refinery plant through ENetOPT implementation
Case Study

ENOP : Power Plant
Power Plant Optimization with ENetOPT & ENetPLAN
Utility Energy Network Planning
ENetPLAN plans energy production and distribution across an entire cogeneration plant. It meets the site's heat demand while minimizing specific energy consumption and maximizing margin, weighing steam, electricity and fuel costs, equipment efficiency and operating constraints in a single MILP model.
Core Capability
What ENetPLAN plans across the utility network, and how far ahead it looks.
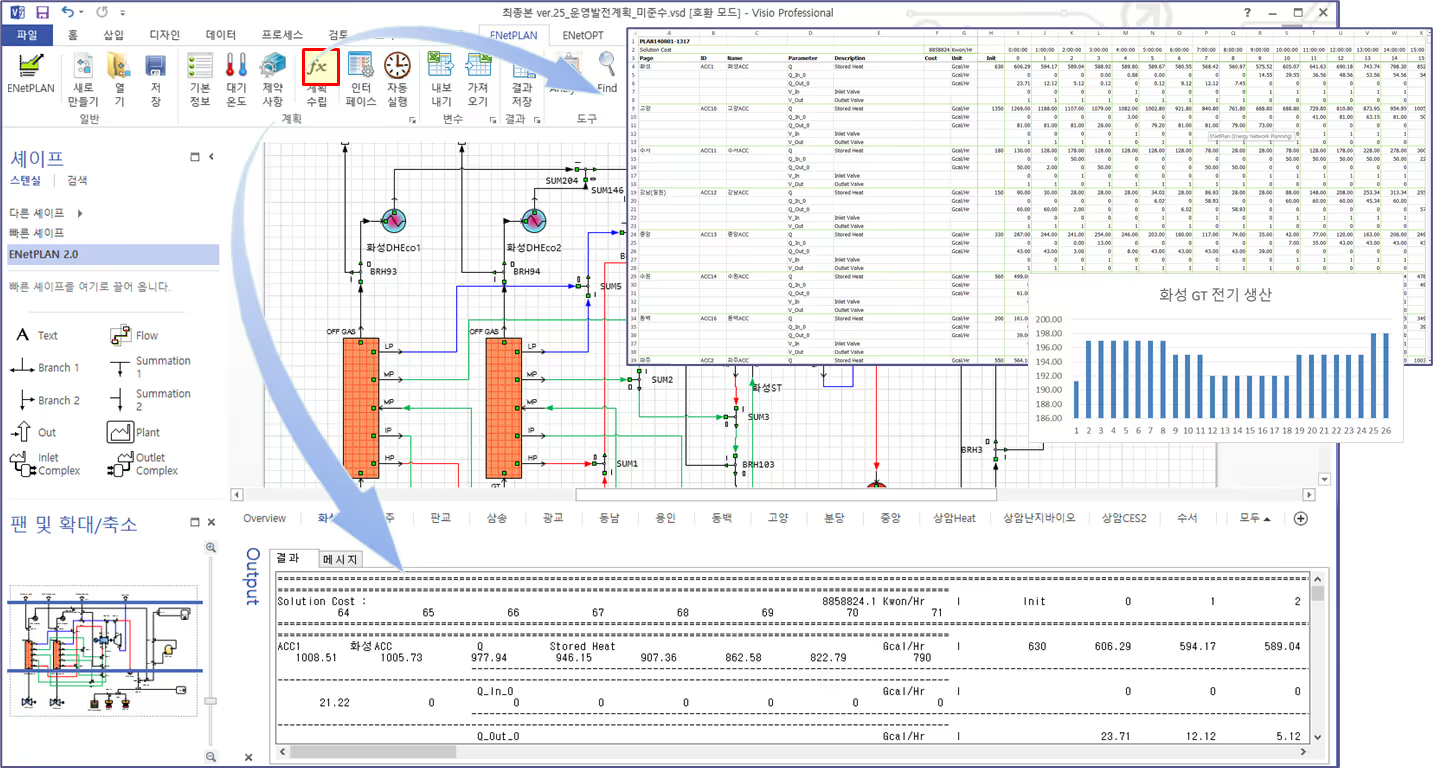
ENetPLAN builds short- and long-term plans for the production, distribution and consumption of steam, electricity, fuel and hydrogen as one integrated network. Horizons range from minutes and days out to multiple years, and the embedded Gurobi MILP solver keeps calculation times practical. Linked to the real-time optimization system, planning and control run as a closed loop.
Production plans are built to minimize specific energy consumption, not only to meet volume. The same model covers hydrogen production, distribution and storage, and schedules energy-intensive equipment such as compressors so that load lands where energy costs least.
Coverage
Beyond the utility network itself, the same planning model covers emissions, renewable assets and demand-side participation.
Forecast CO2 emissions over short and long horizons and build reduction plans against them. Gray, blue and green hydrogen production is planned alongside renewable output, with hydrogen fuel cells and CO2 capture included in the model, and the same structure supports emissions trading.
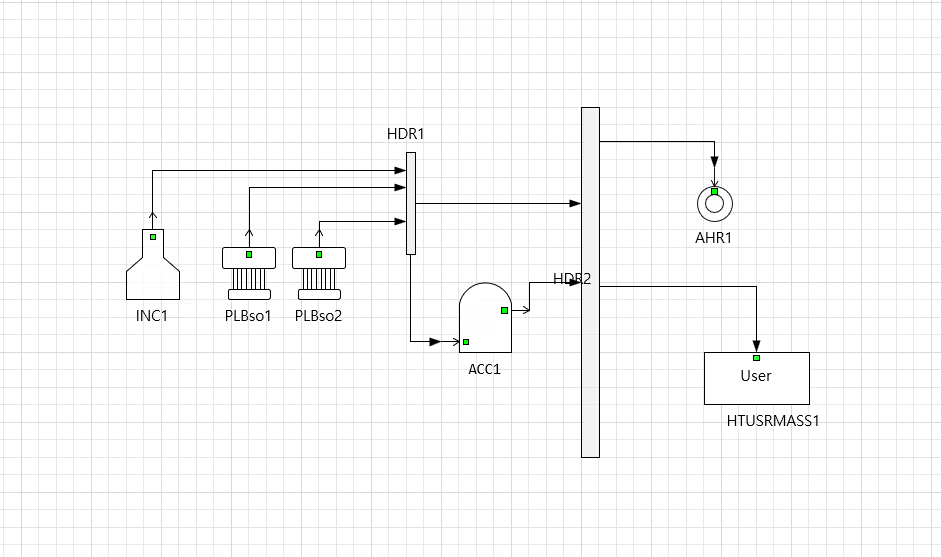
Plan and operate a mixed system of PV, wind, battery storage and LNG or steam turbines as one configuration, integrated with microgrid frequency control.
Identify how much peak load can be shifted in each time band, and support DR trading for both individual sites and groups of users.
Product Tour
Pick a step to see how a plan is built in ENetPLAN, with a short walkthrough for each.
· Drag & Drop based visual modeling
· Multi-Layer Configuration
· Integrated thermodynamic property calculation
· Equation-based system
· Embeds MILP optimization engine
· Able to change optimization engine according to system size
· Flexible planning interval through daily to yearly interval
Why ENetPLAN
Forecast demand, then produce an optimal plan that holds up against real equipment limits and survives contact with the shift.
Set conditions for several scenarios and compare the plans they produce, so stability is designed in rather than discovered later.
Plans are built to minimize energy per unit of product, not only to hit the volume target, and cover hydrogen production, distribution and storage on the same basis.
CO2 is forecast and reduction plans are built alongside the production plan, with hydrogen and capture inside the model rather than bolted on afterwards.
The shiftable peak load is quantified for each time band, which turns demand response into a planned decision rather than a reaction.
PV, wind, battery and turbine assets are planned as one configuration, so intermittent output is absorbed by the rest of the system instead of destabilizing it.
Energy Intensity Management
Infotrol-EIM monitors process energy intensity in real time on an identical-condition basis, diagnoses the cause when an anomaly occurs, and delivers the monitoring and diagnosis results through a dashboard.

Core Capability
What EIM watches on the plant, and what it tells the operating team.
Monitor energy intensity in real time on an identical operating-condition basis, and automatically activate the diagnosis logic when an anomaly is detected.
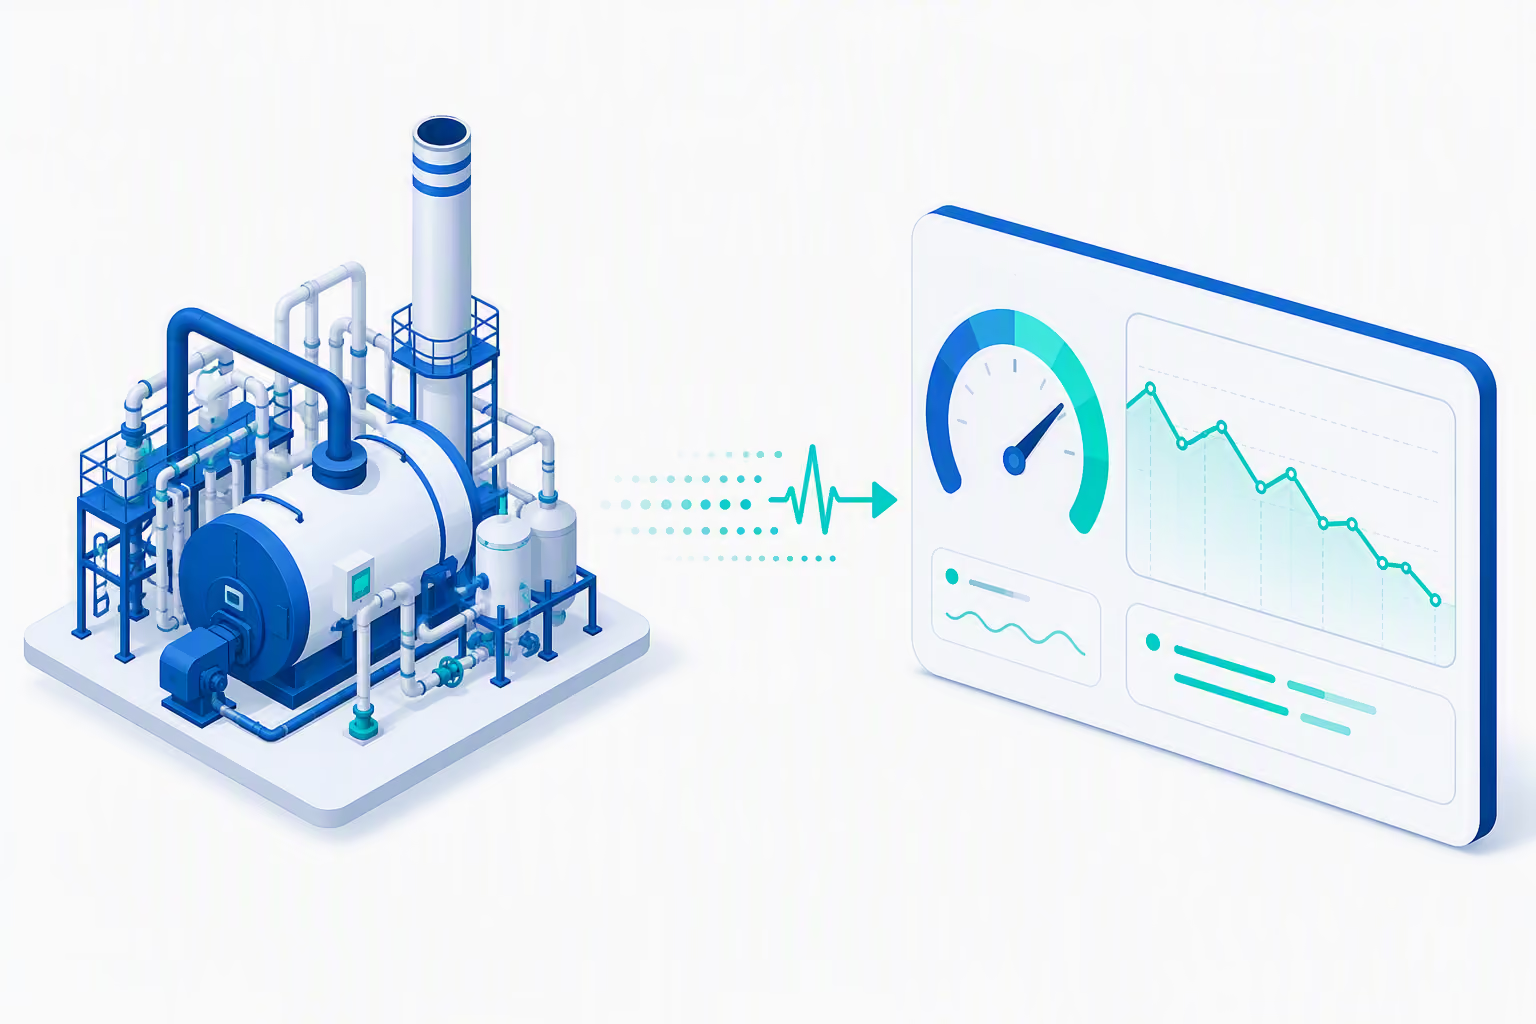
Analyze each process variable's influence on energy intensity with AI, identify the cause through procedural logic, and show the gap versus optimal operation.

Deliver analysis results in real time through a Microsoft Power BI web dashboard, with DCS integration for fast on-site response.

Automatically remove the effect of season, temperature, load, and grade, so energy intensity is compared purely on efficiency rather than operating conditions.

Why EIM
Automatically identify and remove the effect of season, temperature, load and grade, so intensity is compared purely on efficiency.
Get alarms the moment energy intensity rises, instead of relying on after-the-fact analysis.
Diagnosis results are shared immediately, so root causes can be removed while the process is still running.
Reduce energy intensity and cost through timely, data-driven improvement rather than periodic review.
Catch inefficiencies and abnormalities early, before they turn into an unplanned stop.
Surface concrete improvement points and build a basis for continuous operating improvement.
Delivery Process
From process analysis to audit, a typical EIM project moves through four stages.
Collect the key process variables and identical operating conditions, gather existing know-how on what drives energy intensity up and how it is handled, interview operators on site, and define the monitoring scope.
Integrate and collect the process-variable data, then build a data-processing pipeline aligned to the management metrics the site actually works to.
Develop anomaly-detection logic for energy intensity, build AI-based models for variable-influence analysis, and configure comparison against identical operating conditions.
Build the Power BI energy-intensity dashboard, run pilot operation for validation, and close with a site acceptance test and audit under periodic inspection.
Case Study

Infotrol-EIM Showcase
A smart energy management platform that unifies data and diagnoses anomalies in real time.
Talk to our team about SOP automation, advanced process control, and energy optimization for your plant.
Contact us →